Ramblings
Coronavirus deaths - UK
29 April 2020
Unfortunately, the UK changed their way of counting deaths on 29 April 2020. Up to this date, they had been using an isolated population of hospital deaths. They have now included deaths from other sources as well and these extra deaths were added on a single day resulting in a massive spike to their numbers on 30 April. These are shown on the chart below on the curve marked UK (R).
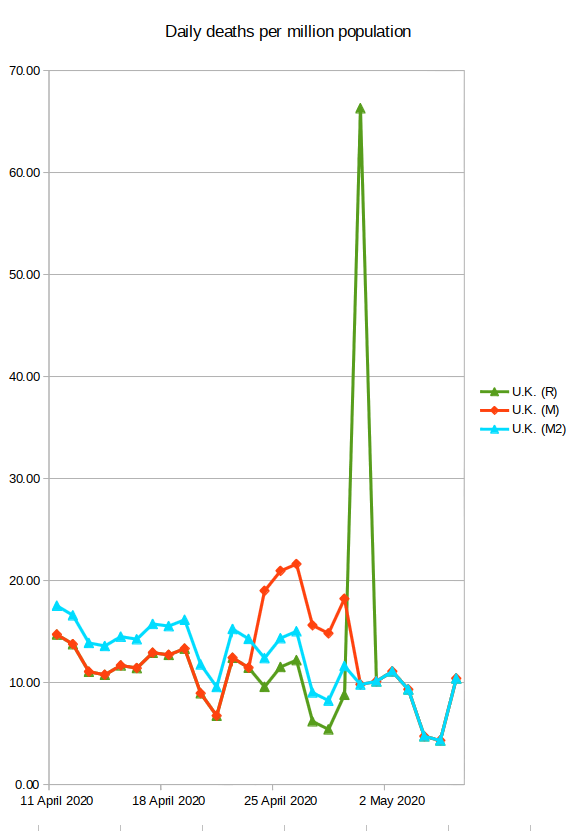
Fig 3. Five day moving average of the daily coronavirus deaths per million population in the UK
This spike exceeds the bounds of Figs 1 and 2 on my Coronavirus deaths page, so I manipulated the data so that the extra deaths causing the spike is shared over the preceding six days. I used a linear least squares regression on those six days to predict the total number of hospital deaths on 30 April (22331 as opposed to the recorded total number of deaths, 26097). The difference in recorded and predicted deaths was then shared over the six days. This new curve is shown in Fig 3 as UK (M). This increased the range to more than 20. In order to reduce the range further, I spread these extra deaths over all data points preceding 30 April. This new curve is shown as UK (M2) in Fig 3, which gives a more acceptable range of 16 in Fig 2 on my Coronavirus deaths page. It also makes the UK death rate the highest in the sample of countries I have been monitoring. Note however, the curve now follows the same trend as the one with hospital deaths alone, prior to the spike.
13 August 2020
The UK again changed the way they counted their deaths on 13 August 2020. According to the UK government page, they again changed the method of counting coronavirus deaths. Because of the transient nature of web pages, I include the relevant excerpt from the website as an image.
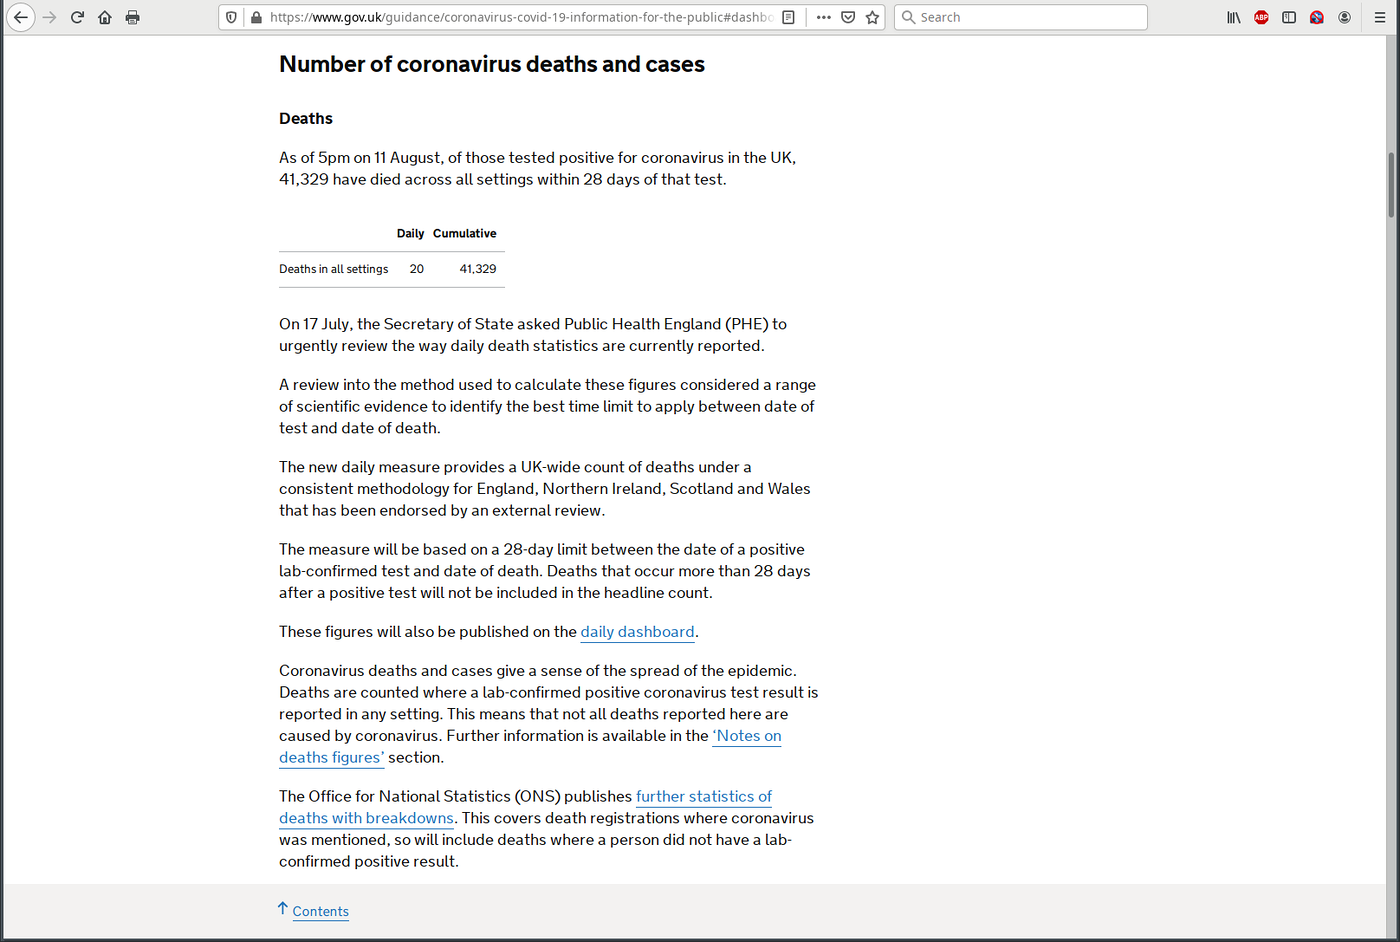
Fig 3a. The change in counting coronavirus deaths
The statisticians have not made a single change as they did on 29 April mentioned above, but changed all the data on their coronavirus death numbers. The image below, show that the Worldometer page has been modified to reflect these new numbers.
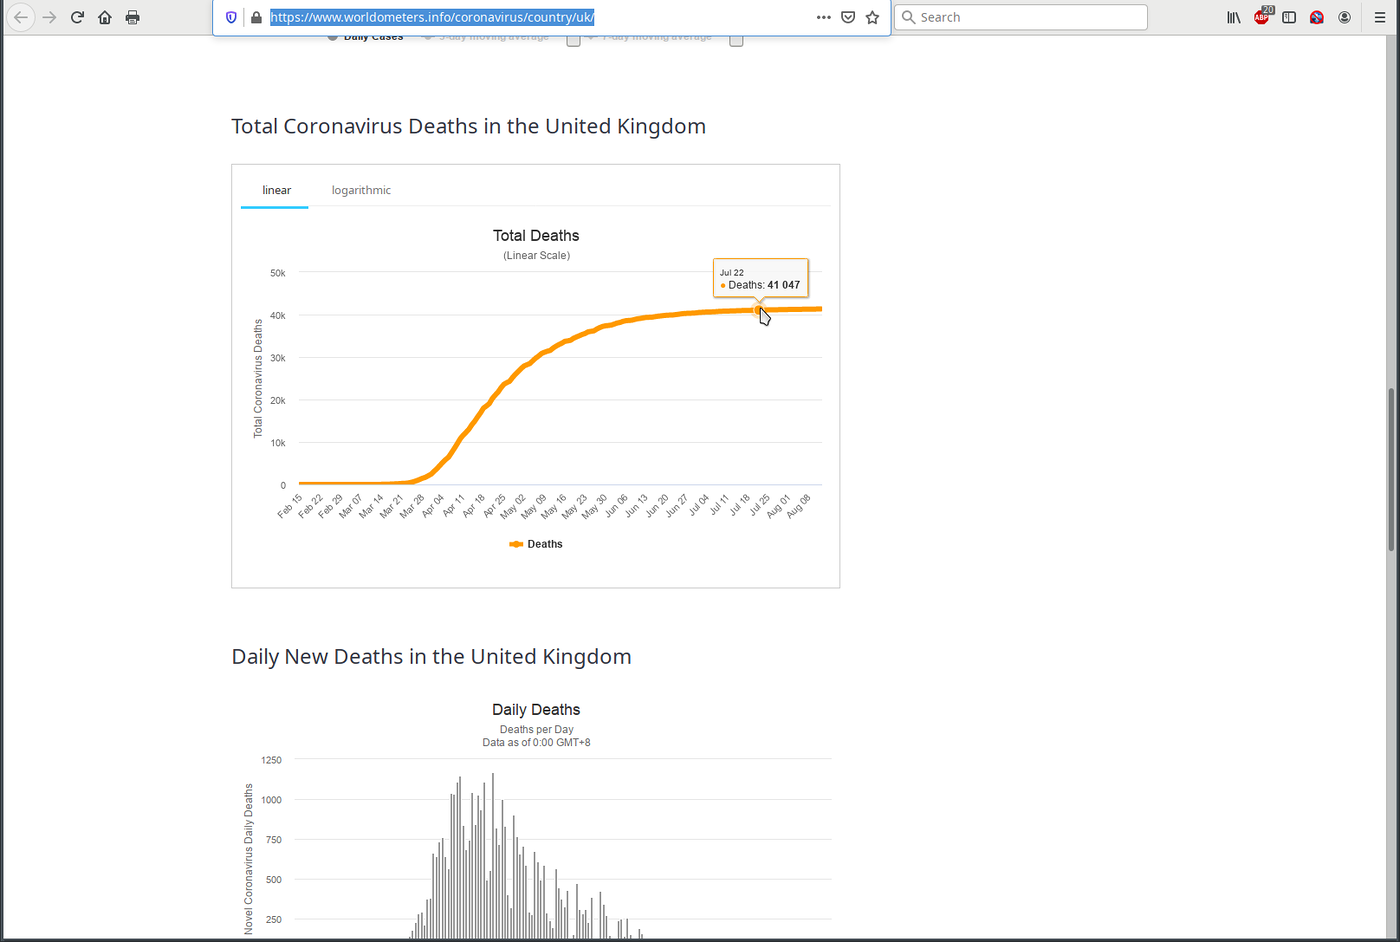
Fig 3b. The Worldometer death chart for the UK showing a value for 22 July
In Fig 3b, a value of 41047 is shown for the total number of deaths as on 22 July 2020. Prior to the change in the counting method, this value was 45422. On the Worldometer UK page, they mention that the new counting method resulted in a decrease in 5377 deaths.
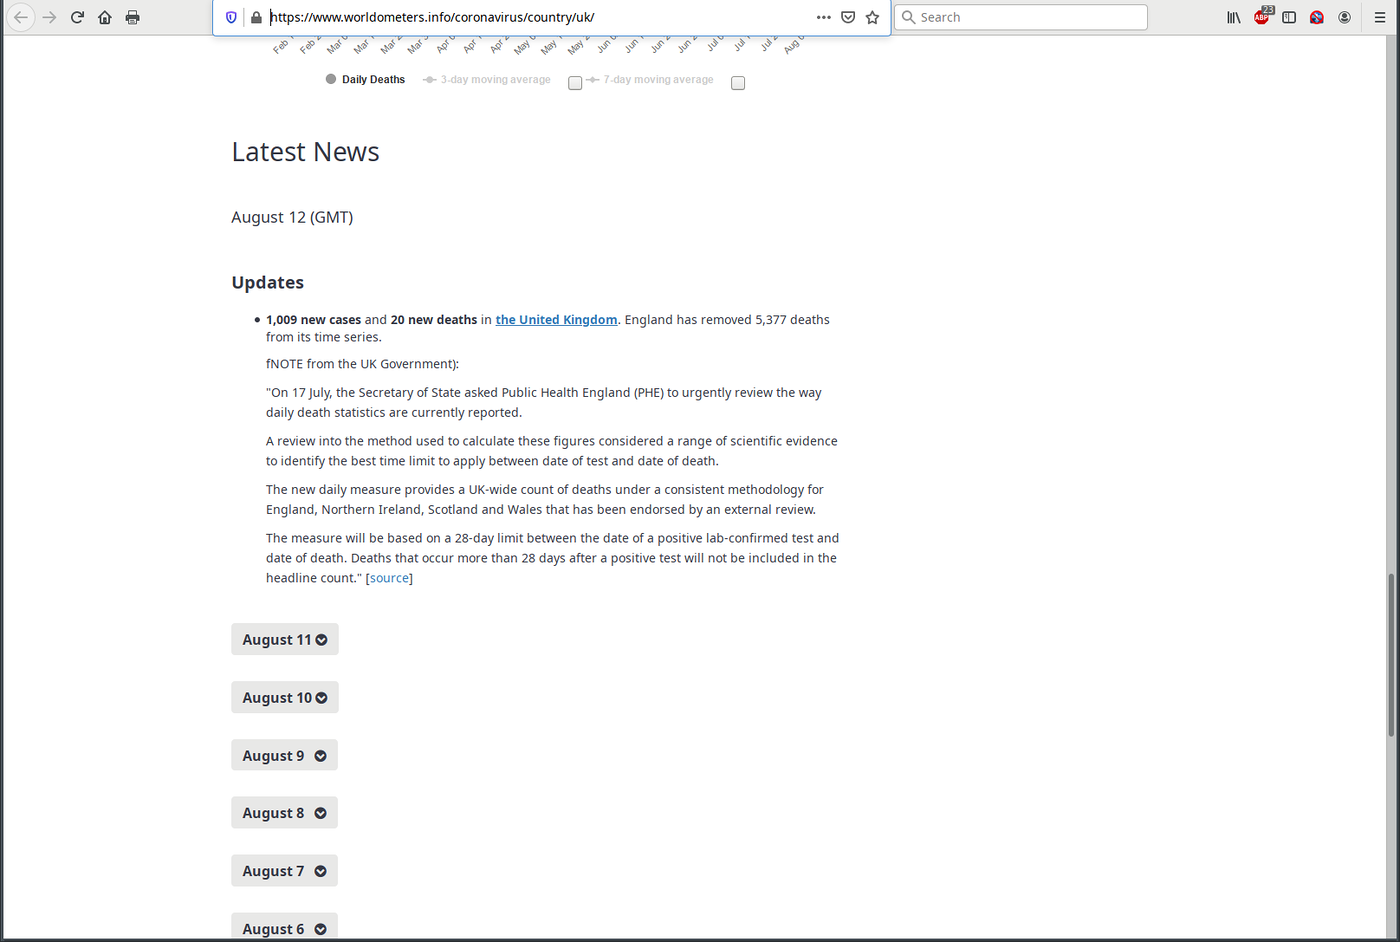
Fig 3c. The Worldometer UK mentioning a decrease of 5377 in the total number of UK coronavirus deaths
The only way I can find to track this "historical" data is to move the mouse pointer along the Worldometer chart shown in Fig 3b. This is an extremely time consuming (and irritating) procedure to follow, especially considering that I have more than 130 data points for each country I have been tracking. In order to continue monitoring the UK, I have decided to add the 5377 deaths to the total given each day. This will still show the trend in the UK death rate, if not the actual values.
(updated: 16 August 2020)